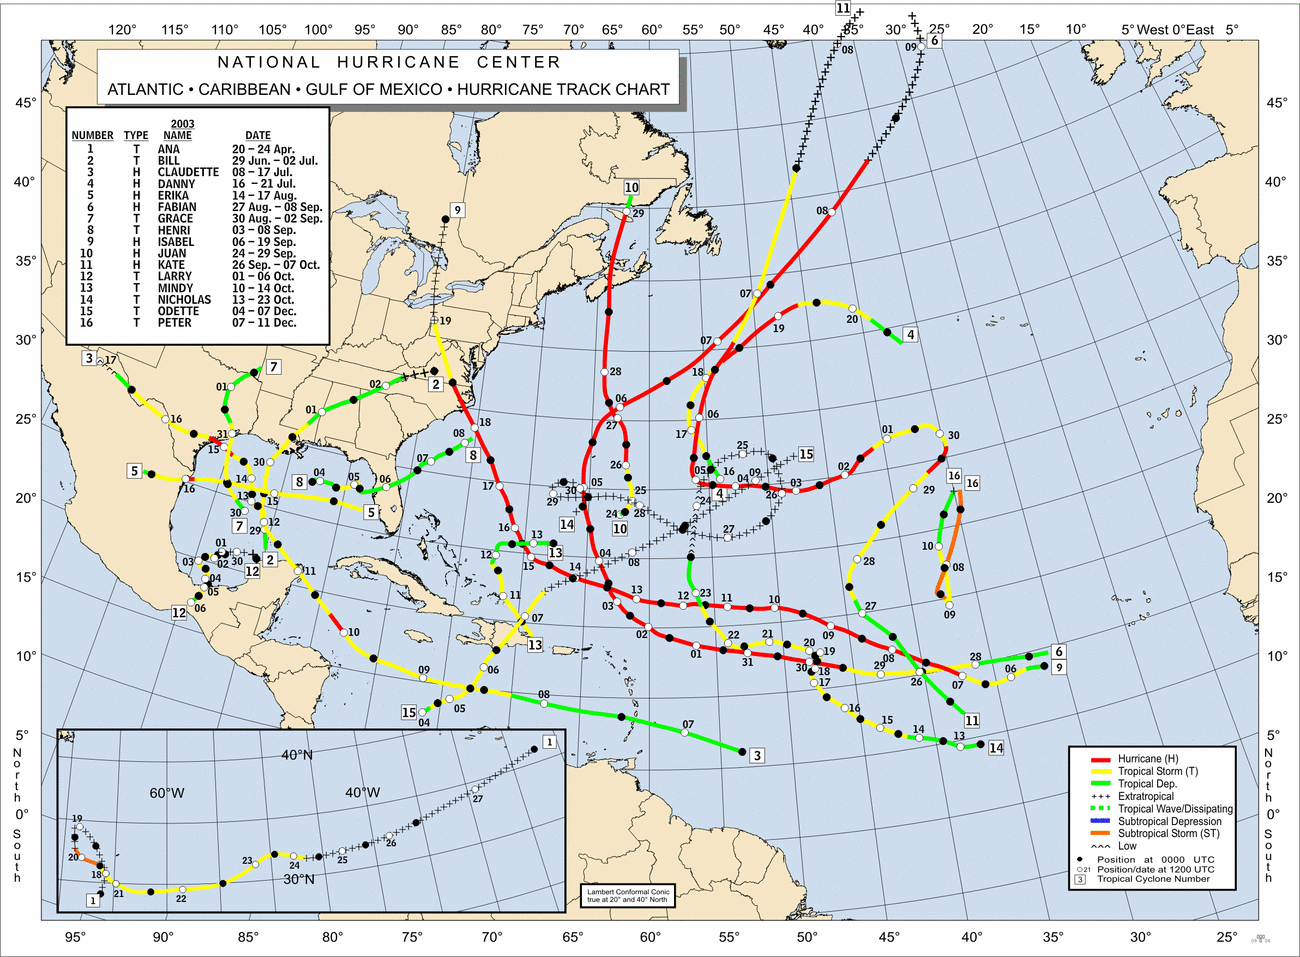
Did some research....
Posted by Shalista on 4/24/2012, 9:05 pm
170
In this thread:
Same set up as 2005? - BobbiStorm, 4/22/2012, 12:09 pm
- Re: Did some research.... - BobbiStorm, 4/26/2012, 11:05 pm
- Re: Did some research.... - Shalista, 4/27/2012, 7:15 am
- Re: Did some research.... - BobbiStorm, 4/26/2012, 11:05 pm
- Re: Same set up as 2005? - Shalista, 4/22/2012, 12:21 pm
- Re: Same set up as 2005? - Fred, 4/24/2012, 7:56 am
- Re: Same set up as 2005? - Shalista, 4/24/2012, 4:54 pm
- Re: Same set up as 2005? - Fred, 4/24/2012, 7:40 pm
- Re: Same set up as 2005? - Shalista, 4/24/2012, 4:54 pm
- Re: Same set up as 2005? - jimw, 4/22/2012, 5:35 pm
- Re: Same set up as 2005? - Shalista, 4/22/2012, 5:39 pm
- Re: Same set up as 2005? - BobbiStorm, 4/23/2012, 4:32 pm
- Re: Same set up as 2005? - Fred, 4/24/2012, 7:55 am
- Re: Same set up as 2005? - BobbiStorm, 4/23/2012, 4:32 pm
- Re: Same set up as 2005? - Shalista, 4/22/2012, 5:39 pm
- Re: Same set up as 2005? - Fred, 4/24/2012, 7:56 am
Post A Reply
This thread has been archived and can no longer receive replies.

